The Relationship Between Inflation and Stock Prices
How to estimate the effect of inflation on market risk
In order to see how inflation impacts the price and value of stocks, we must start from the indicators of future inflation, and move down the effect chain.
In the next three segments, we will discuss what influences inflation, how to measure it, how are markets reacting, and what is the implication of inflation at a certain level.
You can also scroll down to the end of every section and find the summary!
From Rate Hikes to Inflation
Central banks and reserves all over the world are engaging in pushing the market to increase interest rates in an attempt to reduce inflation.
One of the most anticipated developments for investors last week was the 0.5% rate hike from the Federal Reserve in the U.S.
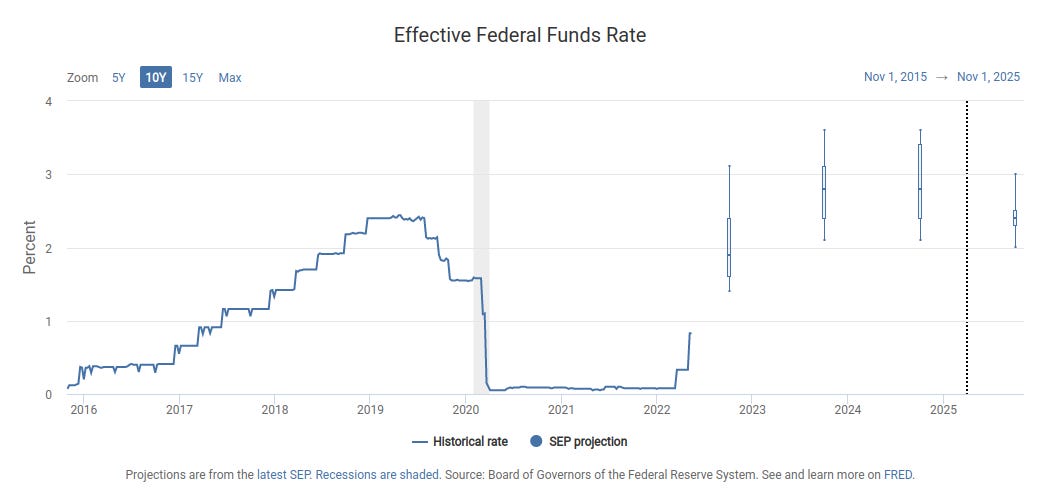
The target federal funds rate is now set to 0.75% as of 4-May, 2022. Which puts the effective “Fed rate” at about 0.83%.
In the chart below, we can see where current rates are, as well as what is the range of expectations for future rate hikes. These expectations are set by the official press release of the Federal Open Market Committee (FOMC), and can change over time.
We can see that currently, the FOMC expects rates to rise to around 2.8% in 2023 and 2024. The Fed rate usually follows inflation patterns, and investors that think these projections are too optimistic/pessimistic can use a variety of tools that help estimate future rates:
CPI & Core CPI percent changes from a year ago - help measure the change in price of a basket of consumer goods.
10 Year & 5 Year Breakeven rate - denotes the expected inflation in 5 and 10 years from now.
The breakeven rates are calculated based on long term Treasury Bond rates minus the expectation for real (TIPS) growth.Note: the TIPS or expectations for real growth, are based on the expected growth in future (usually next year) earnings for companies.
In essence, inflation is comprised of the expected growth in profit for companies next year (real growth) plus the rate at which debt is traded. The Fed usually sets the minimal rate of trading debt, but lags behind the rates at which markets are already trading debt.
Summary
The FED is following market rates by setting the effective minimal borrowing rate. Investors use rate hikes and press releases from the FOMC in order to build-in expectations of future inflation and monetary policy related to quantitative easing.
The current FED rate is 0.83%, hiked by 0.5% last week, and investors are building-in projections for a 2.8% rate in 2023 and 2024.
These projections have changed in the past, and can change in the future, so investors may use alternative indicators of where rates will end up in the future.
From Inflation to Markets
In order to assess what this means for investors, we can analyze how the market performed last week.
In our sector breakdown, we can see that the Consumer Discretionary sector was the worst performer, with companies such as Amazon (NASDAQ:AMZN), Alibaba (NYSE:BABA) and Airbnb (NASDAQ:ABNB) losing more than 7% last week.
The future of the market seems to be concerning for investors, as the trailing market PE valuation dropped to 16x last week. This means that investors are willing to pay 9% less than the January 2022 valuation of 17.6x PE.
In the chart below, we can see how analysts forecast future earnings for the market and by sectors - As well as how exposed are individual sectors to higher current valuations.
By adding analyst’s forecasts on top of individual PE ratios, we can get a PE that is adjusted for future growth, and we can use this to look for high exposure sectors as well as sectors where the market has possibly overreacted.
Note: this is a rough approximation! In order to be more precise, we would have to look at individual stocks, factor-in risk, expected returns and profitability.
Summary
Investors are mostly bearish in the Discretionary sector, which coincidentally has the highest forecasted growth.
Conversely, they consider real estate the “safest” place to put their money - however, the future earnings may not be enough to justify current prices.
From Inflation to The Price of Earnings
We can complete our analysis by attempting to include the risk of inflation and see where the PE tends to be at a certain rate.
In the chart below, we can see the relationship of inflation to the PE of stocks.
It seems that when inflation is about 4%, stocks tend to be priced from 15x to 20x PE. Lower rates (2% to 3%), seem to make the pricing more variable, and significant downturns start occurring after 6%.
Blackstone Investment Strategy Report snapshot, accessed via Twitter on May 6th, 2022
The chart authors used the 10-Year Treasury yield as a representation for inflation - which is well justified, as most investors use this rate to calculate risk-return models for stocks, and is used as a baseline for long term debt.
Summary
Inflation tends to increase the risk of stocks, likely making PE values between 15x and 20x an expected range that does not equal signs of stocks being undervalued.
Investors may want to be more cautious when looking for undervalued stocks, and price drops as inflation increases may be justified.


Horrible article. Absolute waste of time to read.