


Google - Alphabet Inc. (NASDAQ:GOOGL) Valuation
Estimated Intrinsic Value at $1.553 trillion ($2.356 per share) with a positive outlook
I valued Alphabet Inc., (NASDAQ:GOOGL) at $1.553 trillion, or $2.356 per share. About 4% undervalued compared to the May 12th close price.
While I estimate that GOOGL is trading around intrinsic value, I think that it is a value creating company which will realize more of its potential as it grows.

Note: all values in our analysis are TTM numbers, unless specified - Sums of the last 12 months. During the presentation, I try to explain what I mean in a simplified way - please feel free to ask if something is new to you.
Our Parameters
I did a 2 stage, free cash flow to the firm DCF for GOOGL, and here are the key value drivers used in the analysis:

In case you haven’t come across a DCF valuation, the concept is fairly simple. We build a 10-year model to estimate the future cash flows attributable to investors. After that, we get a number, example $3 trillion, and say “ok, so Google is worth $3t across its lifetime, but what is that worth TODAY”, for that we “cut” the price by the value of risk.
That’s it, estimate cash flows, shrink them by the value of risk.
Along this process, we do some estimates (image above), here is how and why we choose them.
Revenue Growth
We start off with the rate at which we think the company will grow revenue in the next 5 years.
A 16% growth rate in the next 5 years, with a decay function after that, is a pretty high rate. In effect, it means that we made the annual revenues of GOOGL from $270.3b today, to $865b in 10 years.
Right there is our firs risk factor. GOOGL is already a large company, which makes revenue growth harder to attain. Our argument in support of the estimate is that software is still in expansion, and the company taps into the expansion of the economy via its advertising - we are indirectly assuming that the economy grows in the next 10 years and GOOGL gets a larger share of that growth.
In order to get a better picture of this, we start with the fundamentals of GOOGL. In the chart below, we can see the financial performance of the company:
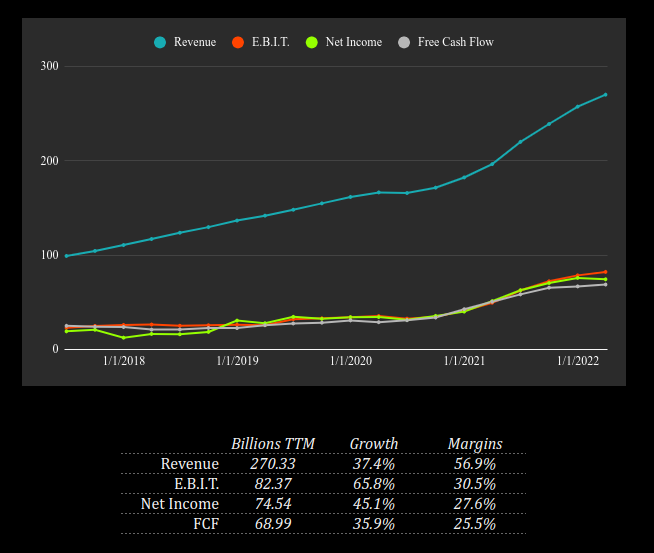
We see that the rate of growth is quite stable. Google has been growing revenues at a CAGR of 23.3% in the last 5 years. Considering that the company is maturing, we can set this as a cap for our growth estimate. In-fact, if we drill down a bit, we can see that pre-pandemic, growth was slowly declining, and we can expect a more realistic future growth rate to be below 20%.

What the chart above reveals, is that the company grew revenues 8% more than costs (COGS), which is great as that is later reflected in cash for investors.
We can also notice that the growth curve will start dropping, but as long as the company doesn’t fall below 16% in the next 5 years, holding all else constant, we should be satisfied with the stock performance.
Margins
Everything is made at the margin.
Margins denote what is left over after different classes of expenses. Investors don’t actually get what is made on the margin, but we use them as a basis to estimate cash flows.
Many use profits/earnings, and that’s ok, but if the cash flows and profits differ, trust the cash flows.
For GOOGL, the margins experienced a bump after 2020, and the best case scenario would be if the company stabilizes around this value - However, the required future growth is likely to cut into the margins, which is why we opted to slowly reduce margins to 26% by the end of the 10-year projection period.

Free Cash Flows
We use the EBIT and EBIT margin to get to our cash flows. It seems that the company is now making free cash flow comfortably above 0 - this is important in case there is a general pullback of the economy the company will remain stable and not lose too much time in damage control.

We calculate the free cash flows as EBIT - Tax - Net CapEx + Change in working capital (if this increases, it means you have less cash).
This is the more precise way to do it, but often people don’t have the data, so they opt to use simple FCF, which is Cash from Operating Activities - CapEx. This is also ok, and usually we would get roughly the same numbers, but it seems that Google is great at generating cash, so we use the FCFF formula.
The two key figures from our calculation are the FCFF at $44.5b and cash from investing at $-39.2. The latter means that GOOGL is reinvesting $40b into the business, which should drive future growth.
Interestingly, the returns to investors are about 3.5% calculated as outflows from financing / Market cap around the 30th March 2022. As the economy tightens, this will not be enough for investors, and GOOGL must choose how to return more capital, else investors will start abandoning.
This leads us nicely to our next section.
Risk
We saw that the company returned some 3.5% in the last 12 months, but how much should it return? Or, how much is “priced in” as a return.
I arrived at a cost of capital of 8.85% for Alphabet (what it should return per year).
Here is the interesting part… 1 year ago this was around 5-6%, but now things have changed, here is how we got the estimate.
I used today’s 10-Year T. Bond of 2.82% as our basis for risk (a riskfree rate).
The implied equity risk premium (what investors demand for investing in stocks), is between 5.23% and 5.14% - I went with the former.
For our company specific risk, we looked at the Q1 2022 revenue breakdown:
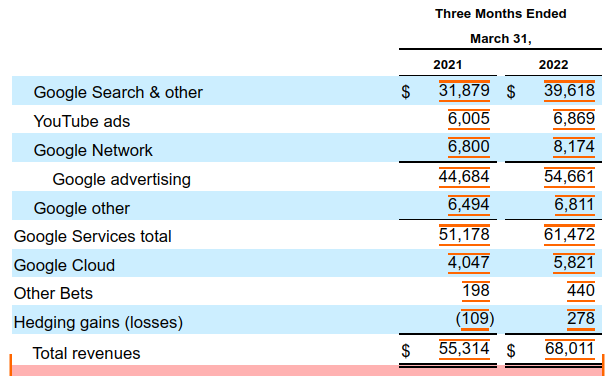
We can see that about 80% of revenues still come from advertising,which has about 3% less risk than the average stock, but the remaining 20% in the software segment are 10% more risky - Think about it, how many projects did Google shut down because they weren’t feasible?
Finally, we estimate, that the stock is some 5.6% riskier than the market (Bottom-up levered beta of 1.056).
Combine all these together (with some finessing) and we get our initial cost of capital at:
2.82+5.76*1.056 = 8.85%* approx.
*The full calculation includes the cost of debt
Now for the returns.
Returns
The returns are mainly important regarding 2 things.
One to see how “wisely” management reinvests into the business and how will that reflect in future growth.
Second, to see if and how much value is created as the company grows.
The first helps us with the valuation, and the second with the outlook.
The sales to capital helps us with the efficiency of reinvestment value driver.
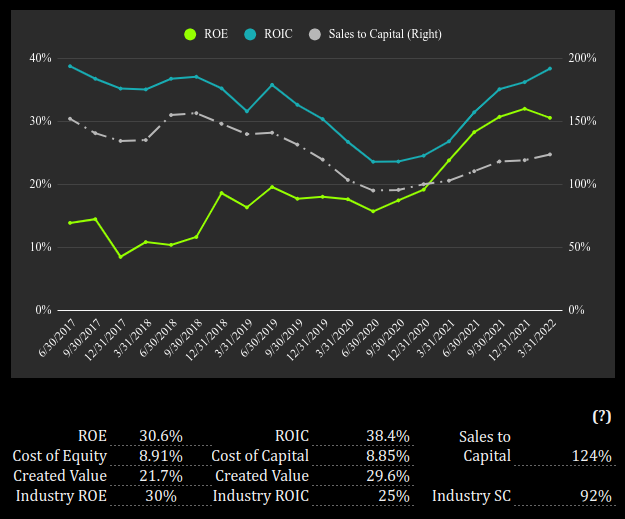
We can see that currently, for every $1 total capital invested in the company, it gets $1.24. Mature companies find it harder to maintain high rates and slowly converge to industry standards. The exceptions are high ROIC companies, market leaders and monopolies.
While Google is certainly a market leader, it had difficulties breaking out new niches other than advertising. Additionally, consumers can and do choose services other than Google Ads for their needs, so it stands to reason that these high performing metrics will start declining.
This is why we went with a 110% efficacy of reinvestment across the model period, down from the current 124%.
Finally, we address the positive outlook.
Alphabet is still growing, and as it grows, we can roughly see if it creates value for investors. We do that by taking the return metrics ROE, ROIC and subtracting their respective cost metrics.
For GOOGL, we can see that 25% of the growth each year is translated into new value.
Practically, we can see this in the stable increase in free cash flows to investors.
Additionally, each year the company grows it brings the value of the free cash flows from the future to the present, thereby eliminating the discount rate (the 8.85% we use to “cut” the value of the projected cash flows).
Summary
I expect GOOGL to grow below historical rates as the company matures. This still means that the company is creating significant value for investors.
I valued the company at $1550 trillion, using a 2 stage DCF with the following parameters:
5-year CAGR 16.1%
10-year EBIT conversion margin 26.3%
Efficacy of reinvestment 110%
Cost of capital 8.85%
I think that the stock is slightly undervalued, and will keep creating value in the future.
This analysis, does not go into long tail risk, such as risk from disruptors, antitrust, spikes in/or prolonged macroeconomic downturns.
I also do not remark on how or if anyone should invest in the stock - that is the role of a personal advisor or portfolio manager, which I am not!
Thank you for reading, and I hope this has been useful.